Student Dashboard Extension
A browser extension that turns myCampus registrations into a clear ECTS planning dashboard for students.
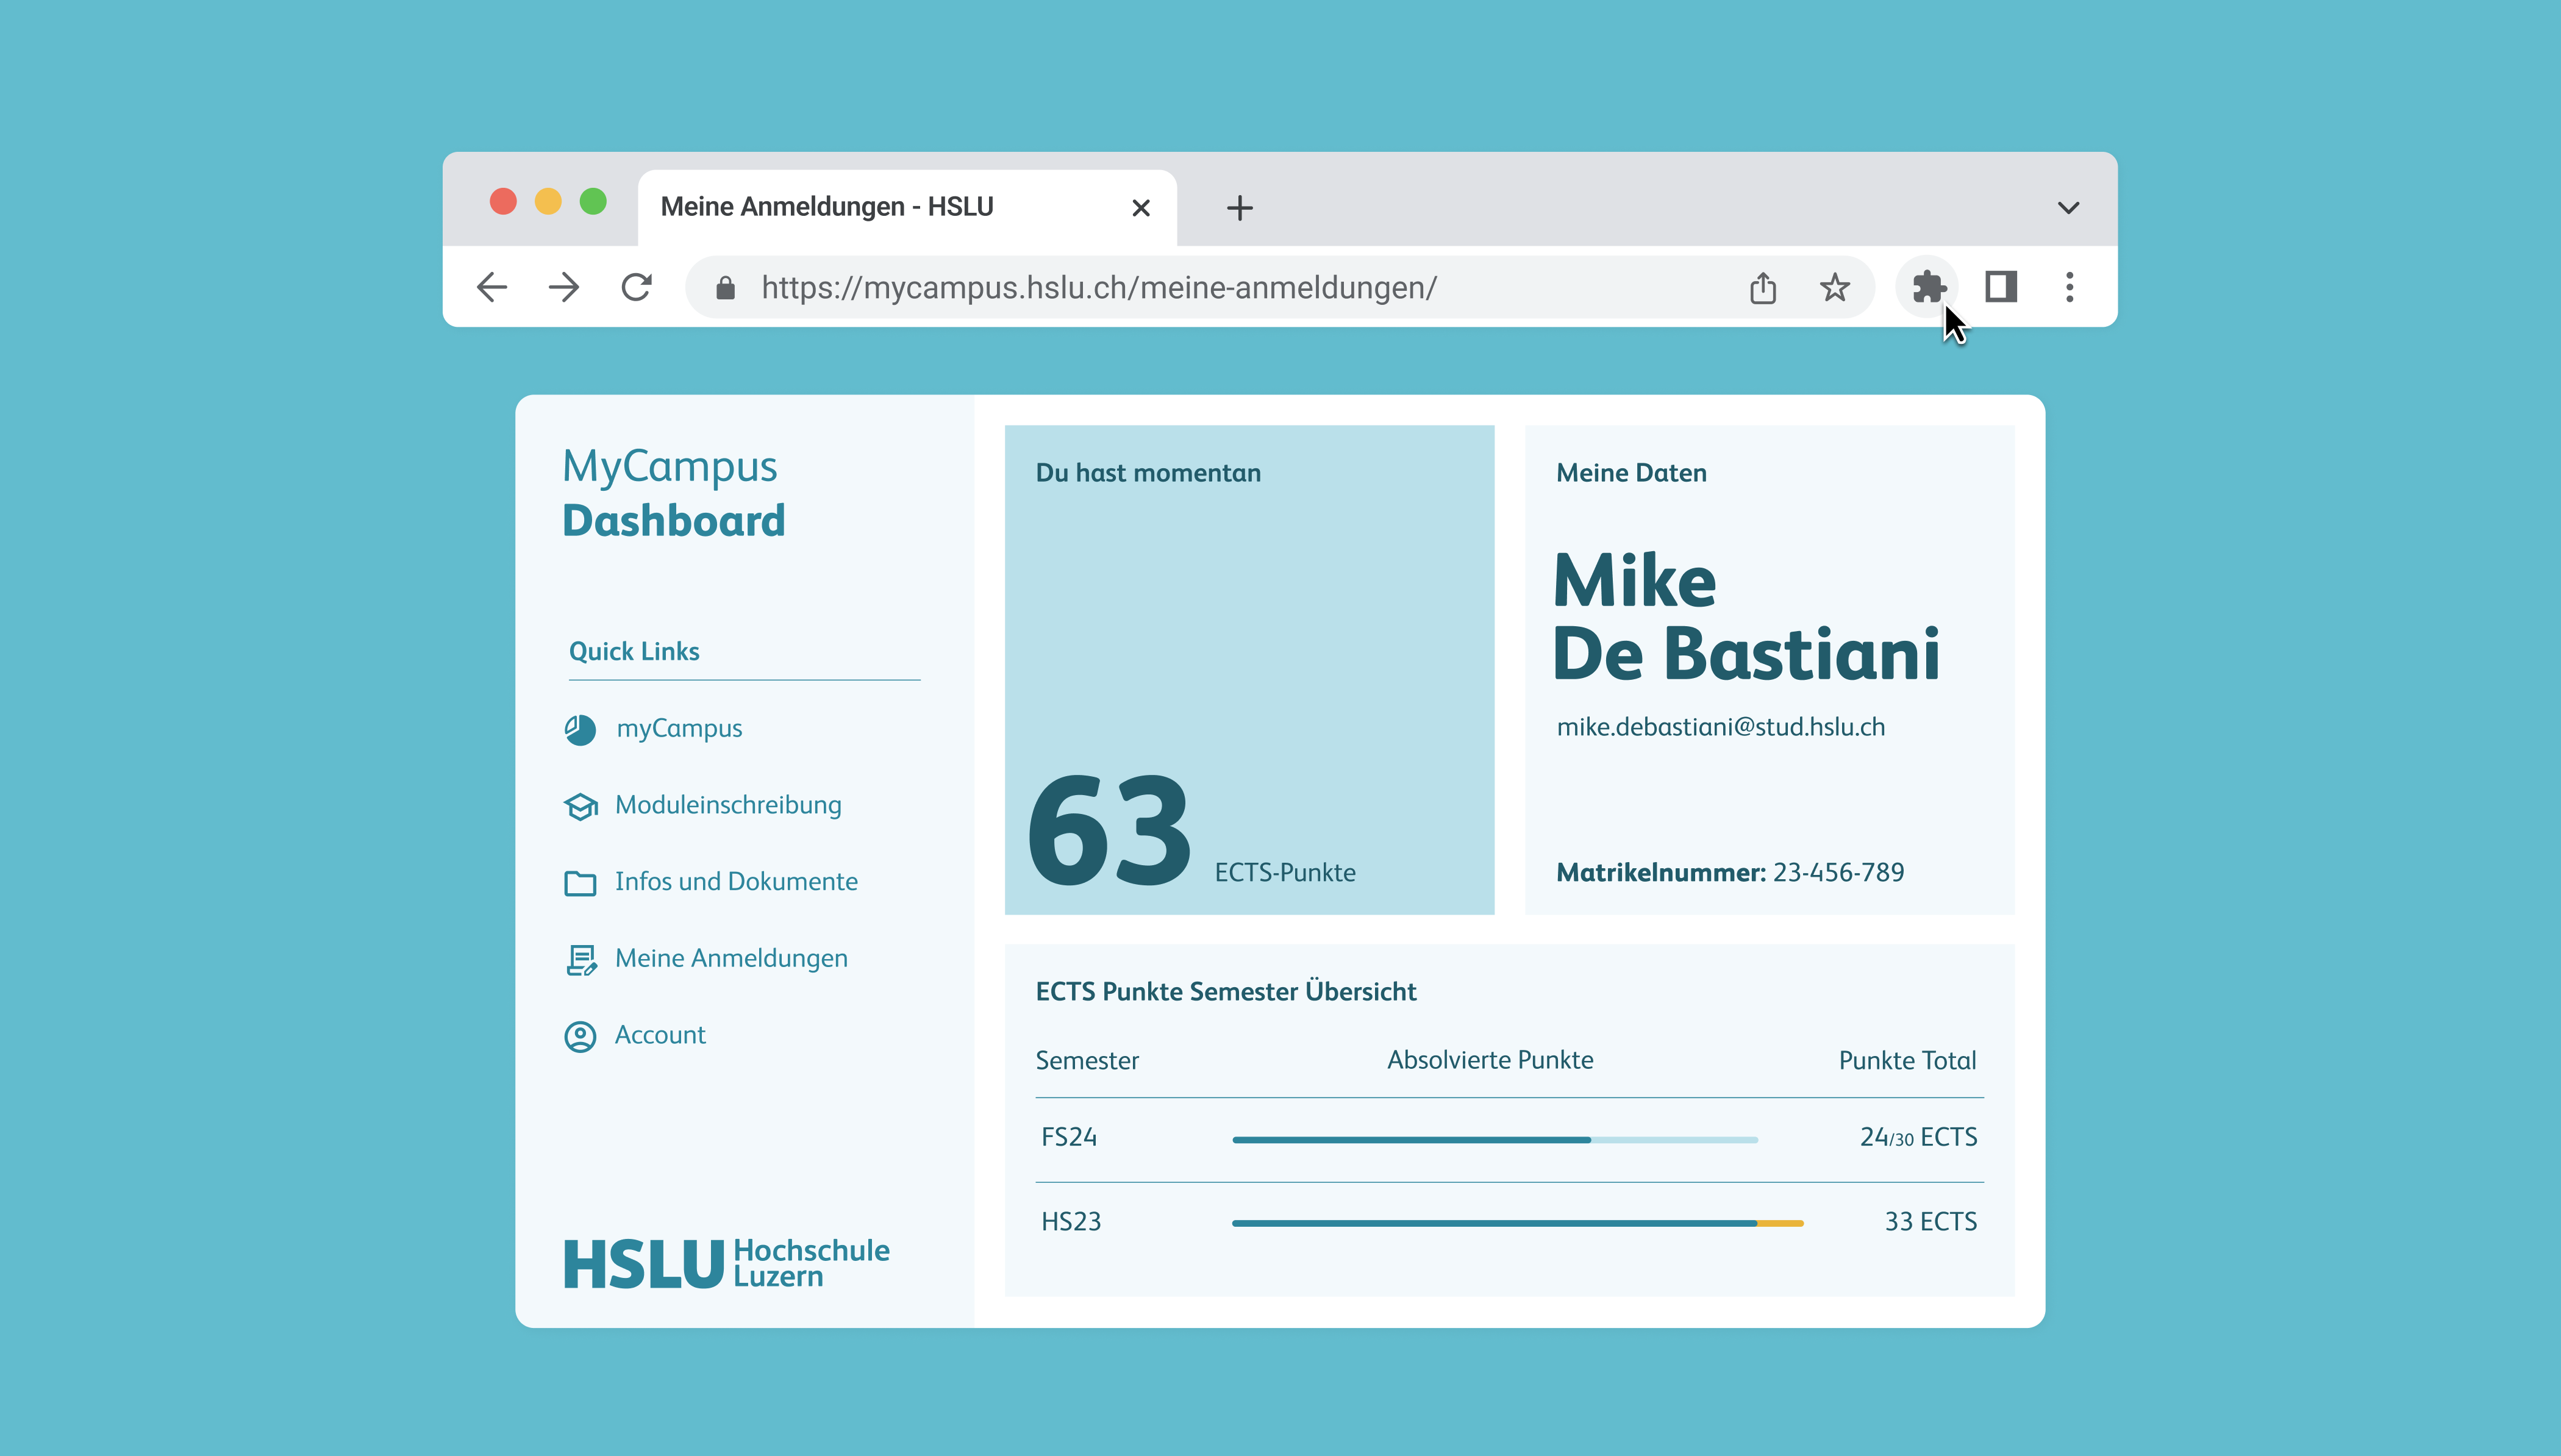
Students at the Lucerne University of Applied Sciences and Arts plan each semester around ECTS credits, yet myCampus does not provide an aggregated overview of completed and enrolled credits. Instead, students have to scan long registration lists and manually add up credit values across semesters. In a one-week student project, we designed and built a Chrome browser extension that extracts ECTS data from the “My Registrations” page and visualises study progress at a glance. The dashboard shows total and per-semester credits with a 30 ECTS reference, and adds practical context such as registration deadlines and quick links. The result is a functional utility prototype delivered with a clear installation and usage guide.
Role
UI Designer & Developer
Context
Student project for myCampus platform
Timeline
1 week in 2024
Team
Me & Yannick Röösli
Outcome
Chrome Browser Extension
Framing the Problem
Students plan semesters around ECTS, but myCampus offers no consolidated credit overview.
Students at the Lucerne University of Applied Sciences and Arts plan each semester around ECTS credits. To choose modules, balance workload, and stay on track, they need a clear view of how many credits are completed and how many are still in progress.
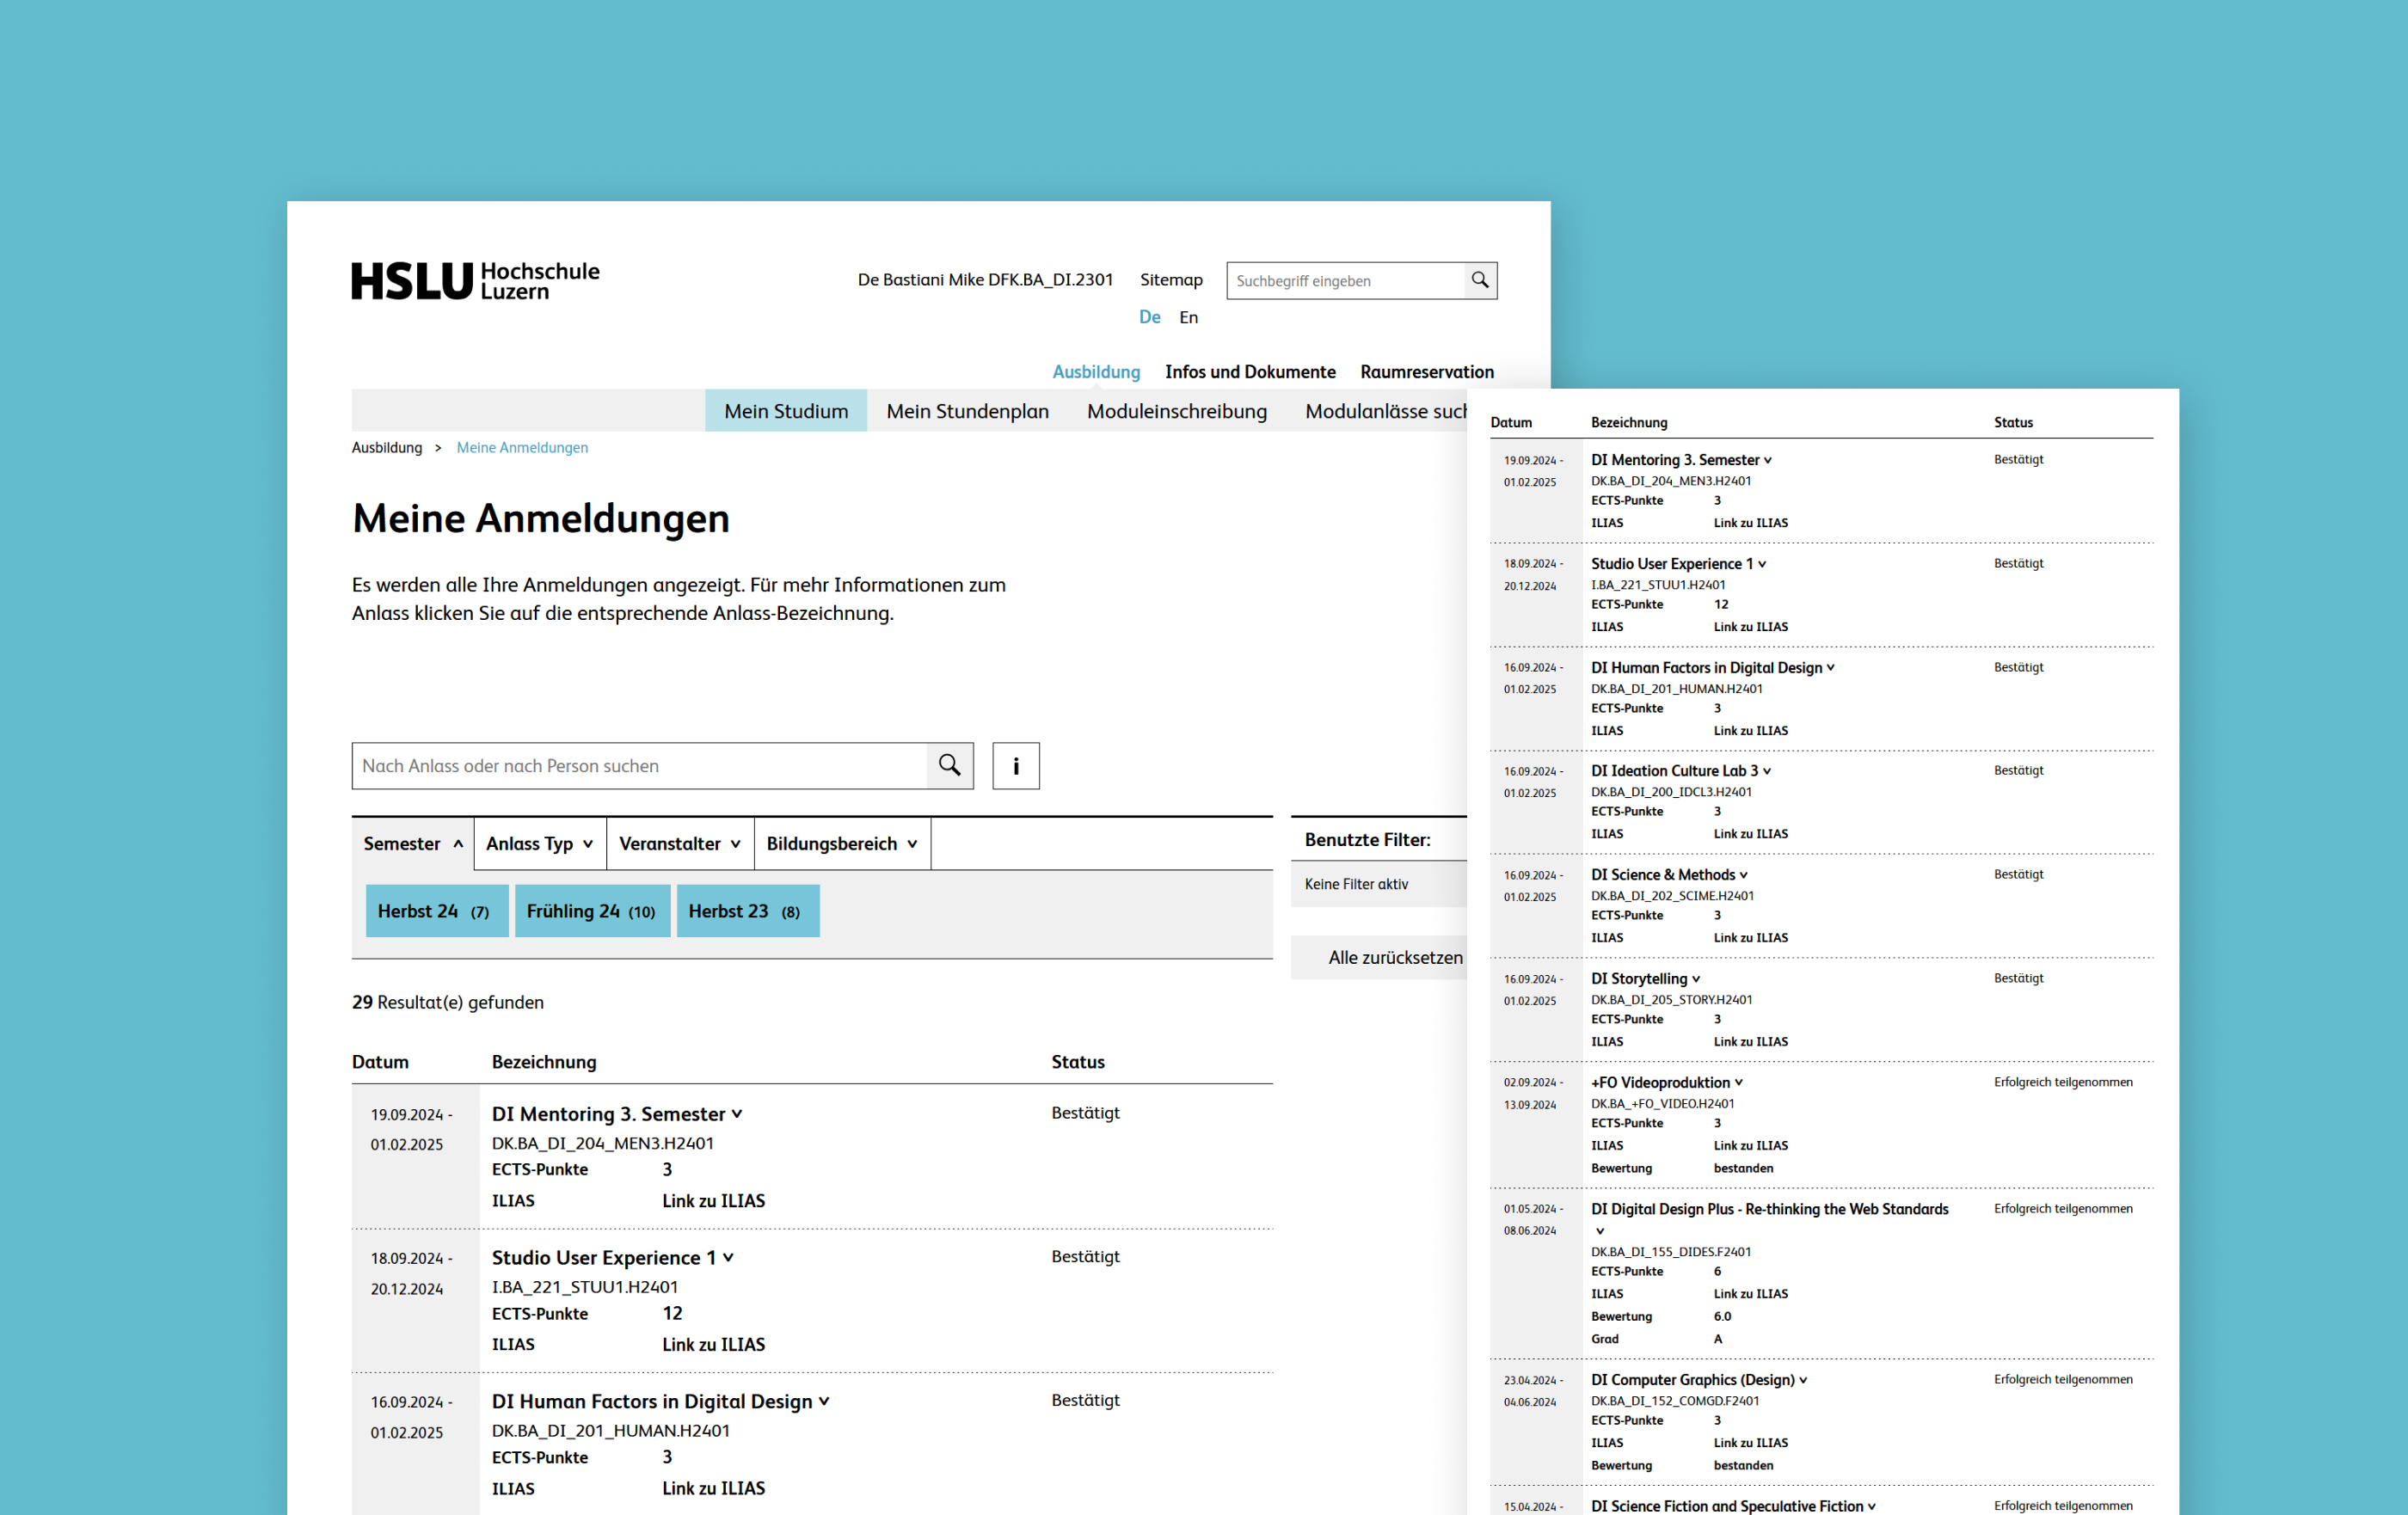
MyCampus contains all registrations, but it does not show an aggregated ECTS total. Instead, students have to open the registration list, scan individual modules, and manually add up credit values across semesters. This is repetitive, time-consuming, and easy to miscalculate, especially as the list grows over time.
Our goal
Create a solution that integrates seamlessly into the existing myCampus flow. We built a browser extension that runs directly on the my Campus platform and turns the available registration data into a clear ECTS overview for semester planning.
Our Solution
Clear ECTS totals, semester breakdown, deadlines, and quick access in one place.
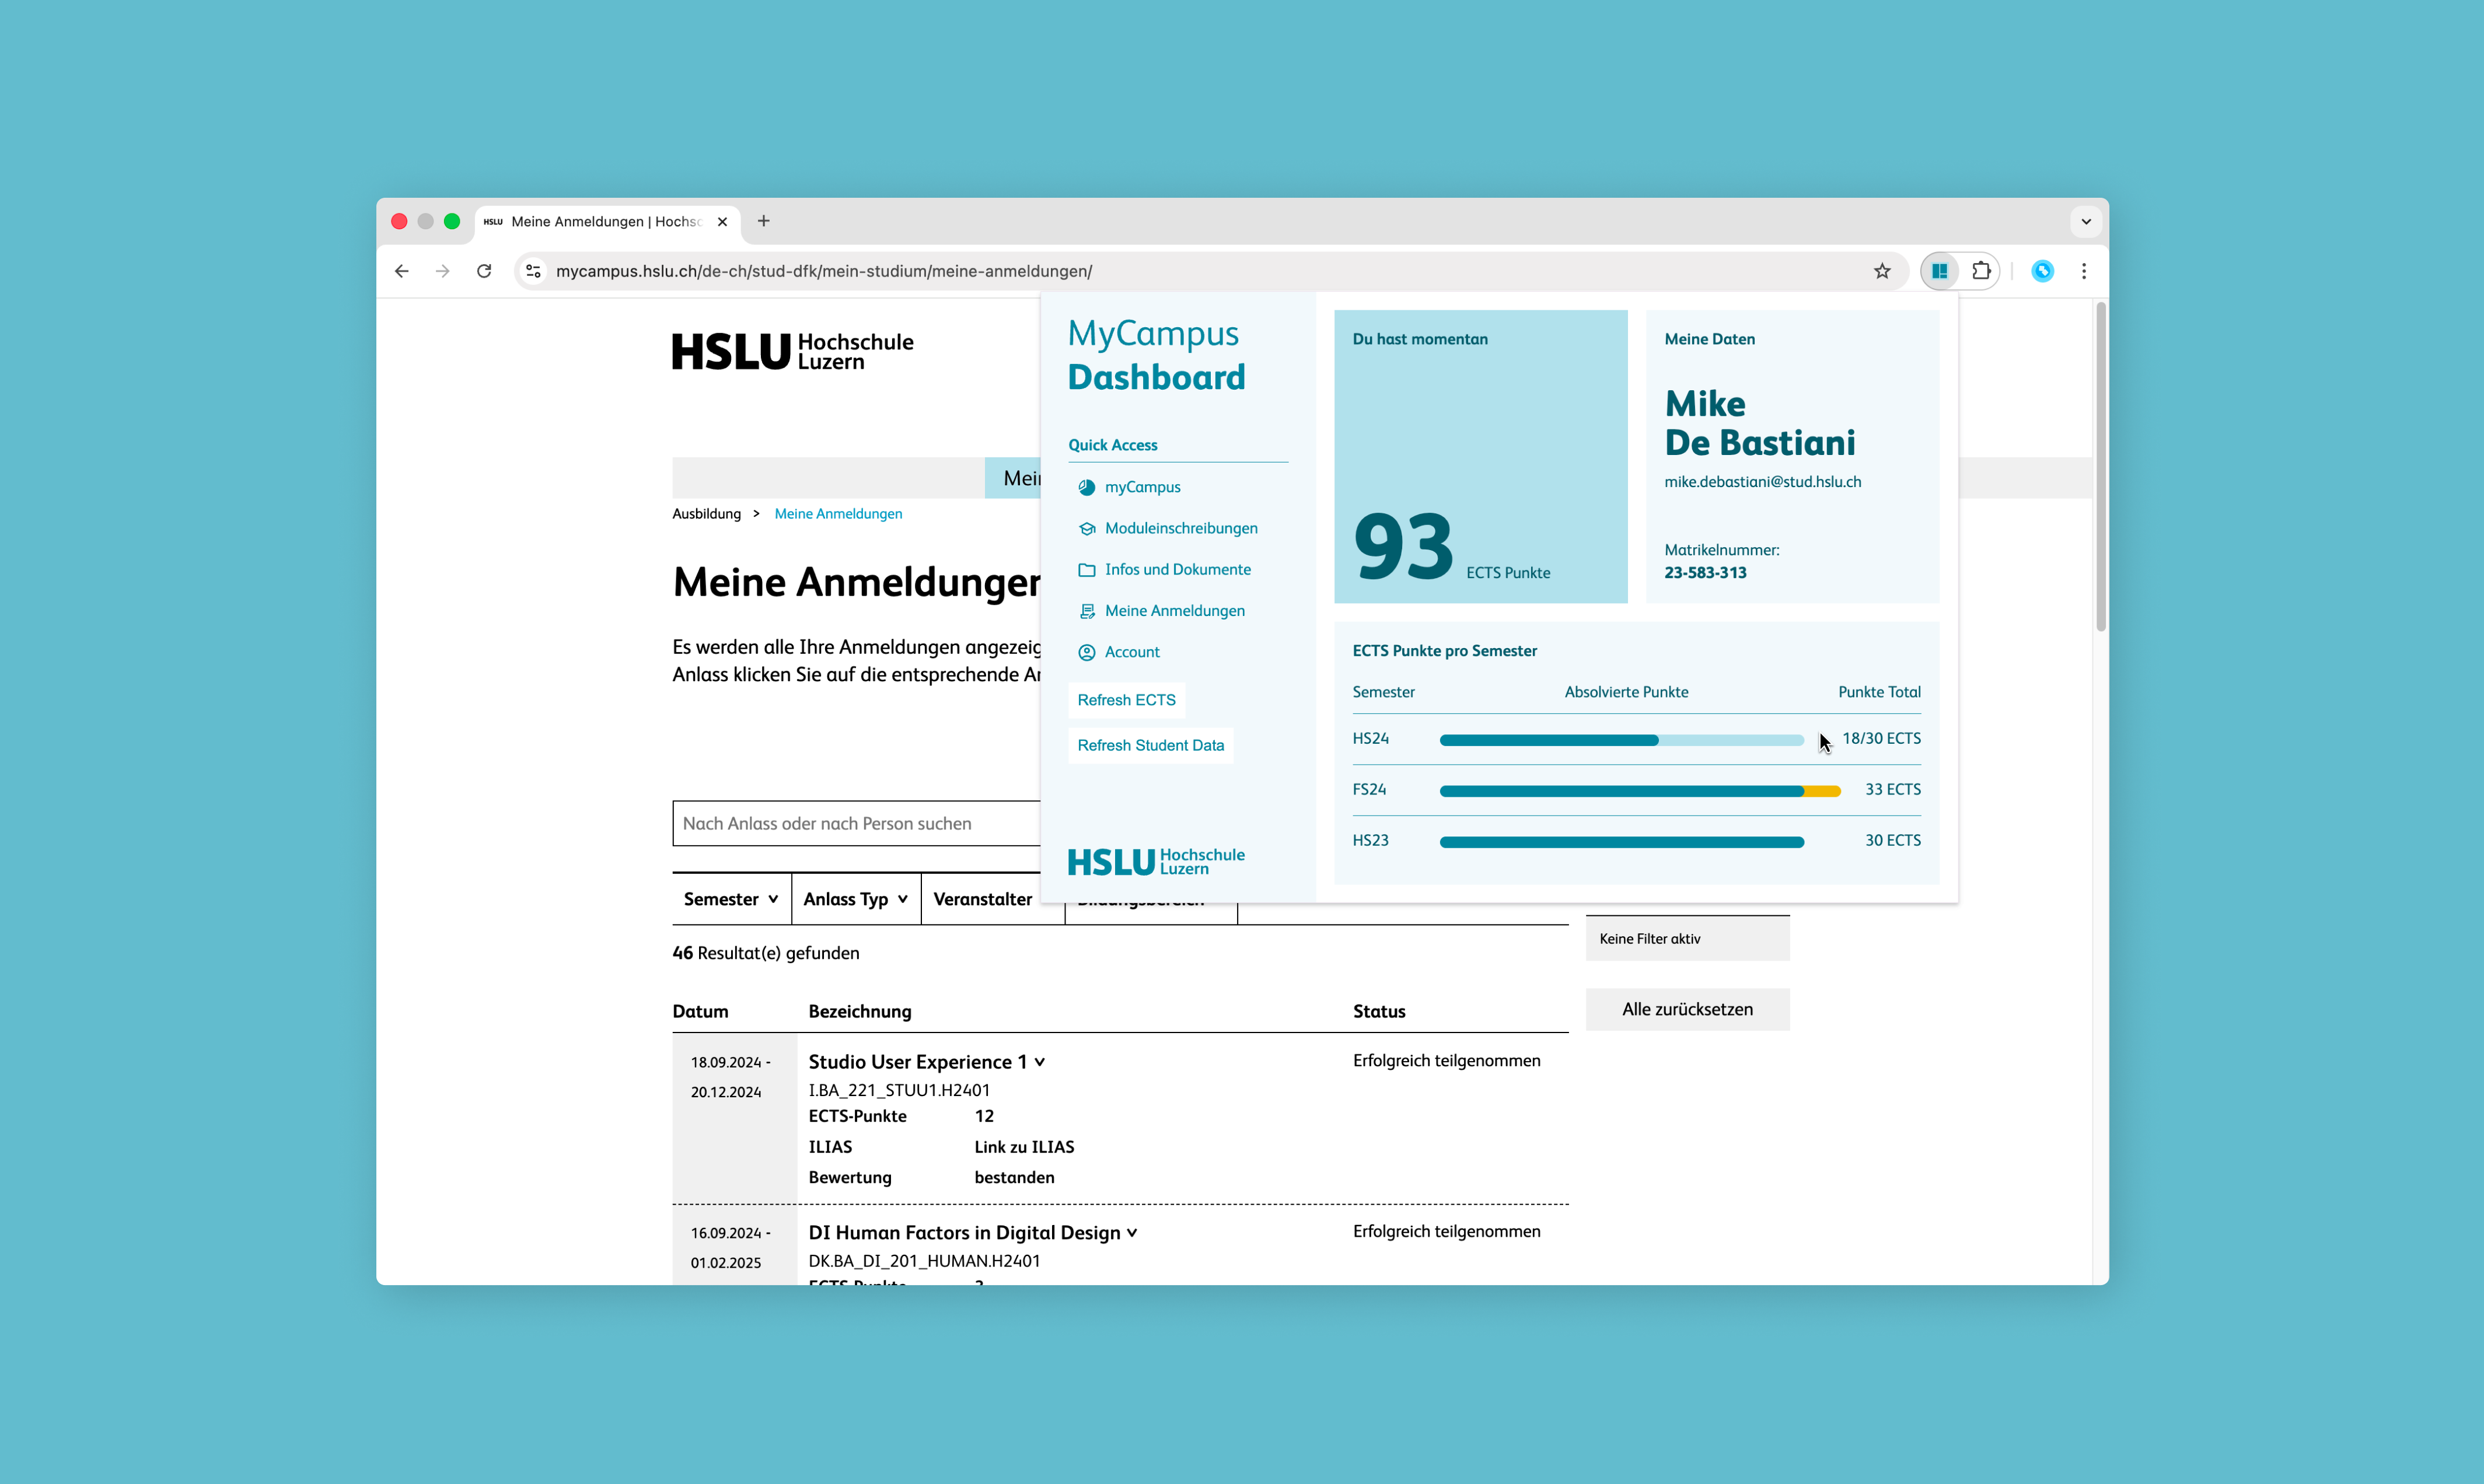
The dashboard brings together a small set of components that turn scattered registration data into a clear overview of credit progress. It helps students understand their total ECTS, how credits are distributed across semesters, and what still needs to be completed. Everything is displayed directly within myCampus, so planning decisions can happen in the same flow where registrations are managed.
Core Elements
Total ECTS overview
A single, central number that sums all registered ECTS credits from myCampus. It includes both enrolled and successfully completed credits, making it easy to see how many credits are still missing across the degree.
ECTS by semester (with 30 ECTS reference)
A semester-by-semester breakdown that shows how credits are distributed over time. It highlights completed credits per term, makes overload semesters visible when credits exceed the typical 30 ECTS target, and distinguishes progress in the current semester between completed and still open credits.
Upcoming module registrations
A compact view that reminds students of the most relevant registration windows. This supports semester planning, because ECTS decisions are often made in the same moment students prepare for upcoming enrolments.
Personal details (fallback concept)
As an alternative to the registration reminder, we explored a personal details panel with name, email, and student ID. This served as a secondary option in case the registration feature could not be implemented within scope.
Quick links sidebar
A small navigation sidebar with shortcuts to frequently used areas in myCampus, reducing friction when switching between planning-related pages.

Finalizing the extension’s design
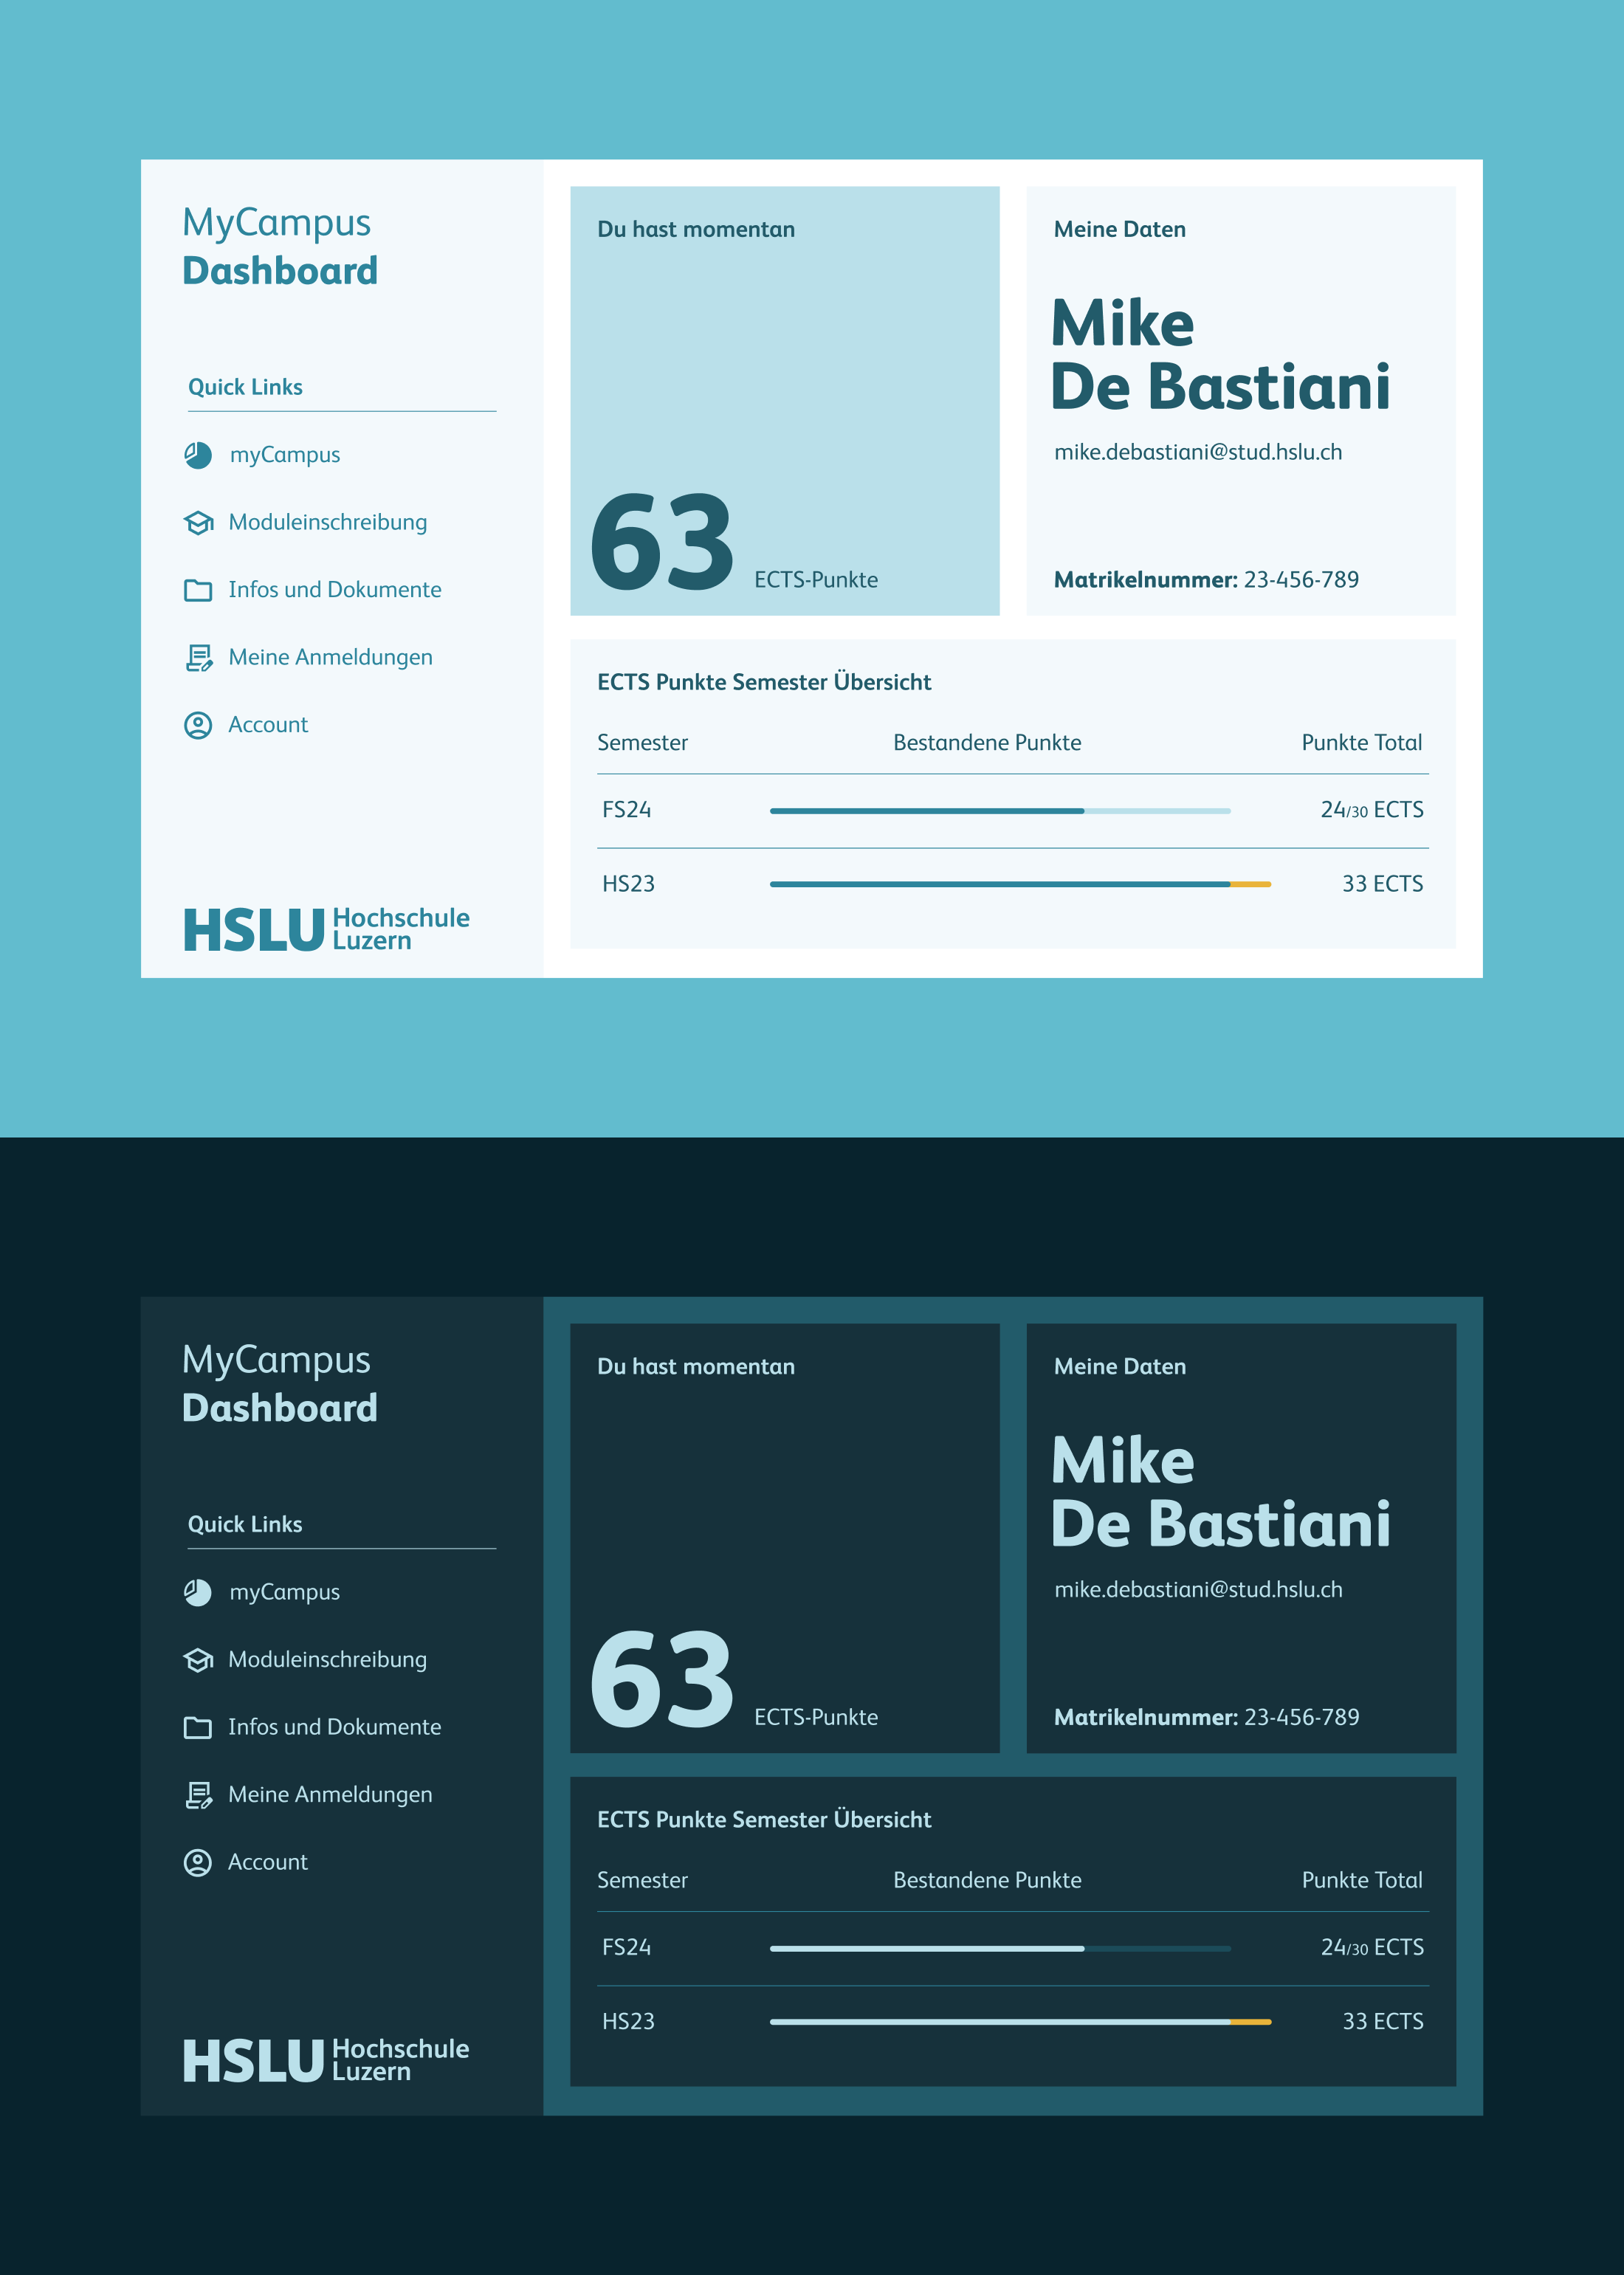
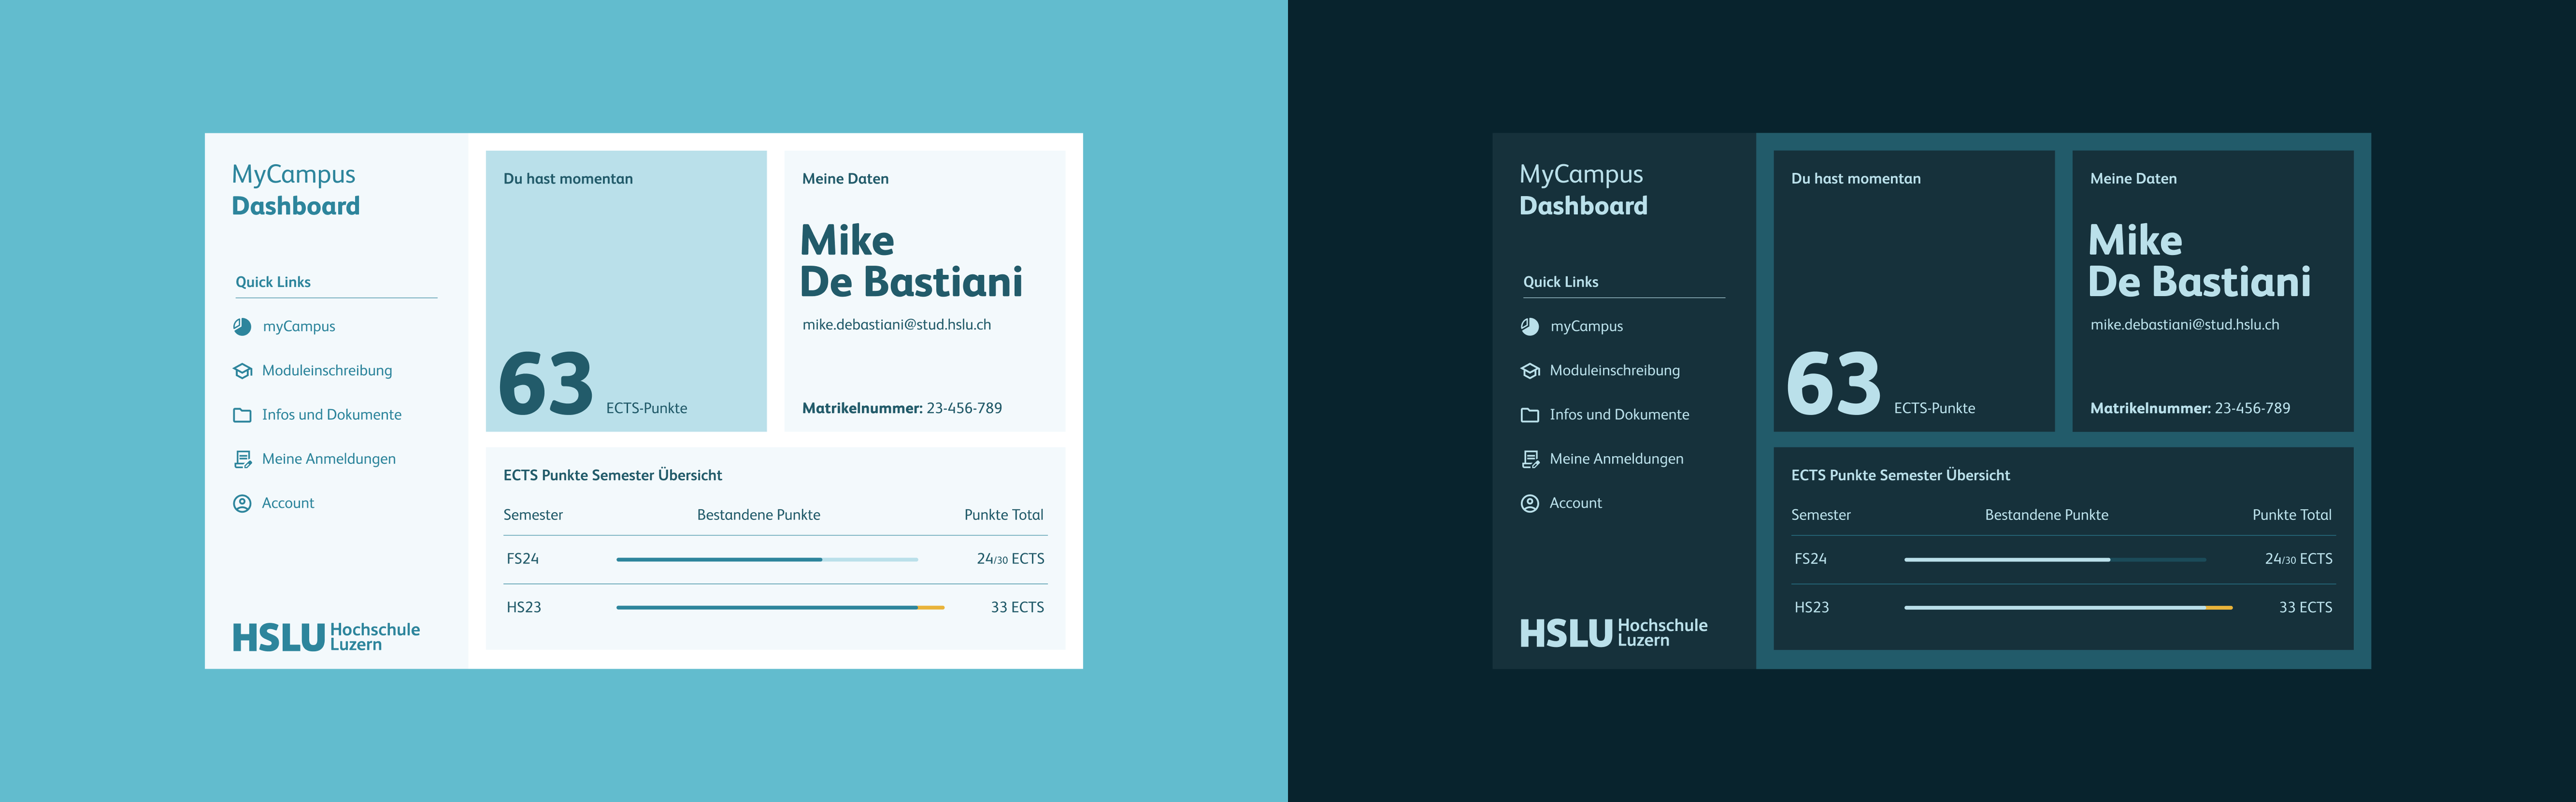
Once the core elements were defined, we refined the layout and visual system in Figma to make the dashboard feel like a natural part of myCampus. We intentionally aligned typography, spacing, and the overall colour language with the existing platform so the extension reads as “native” rather than an add-on.
We explored two themes, a light mode and a dark mode, but decided to implement the light mode because myCampus itself does not offer a dark mode. To speed up implementation and keep styling consistent, we structured the Figma file so we could reliably transfer layout and styling into the codebase using Figma Dev Mode.
Build Challenges
DOM parsing, status logic, and cross page limitations defined the build.
Most challenges were not visual, but structural. We needed to interpret what myCampus already displays and translate it into trustworthy credit calculations, while keeping the interaction transparent within the constraints of a browser extension.
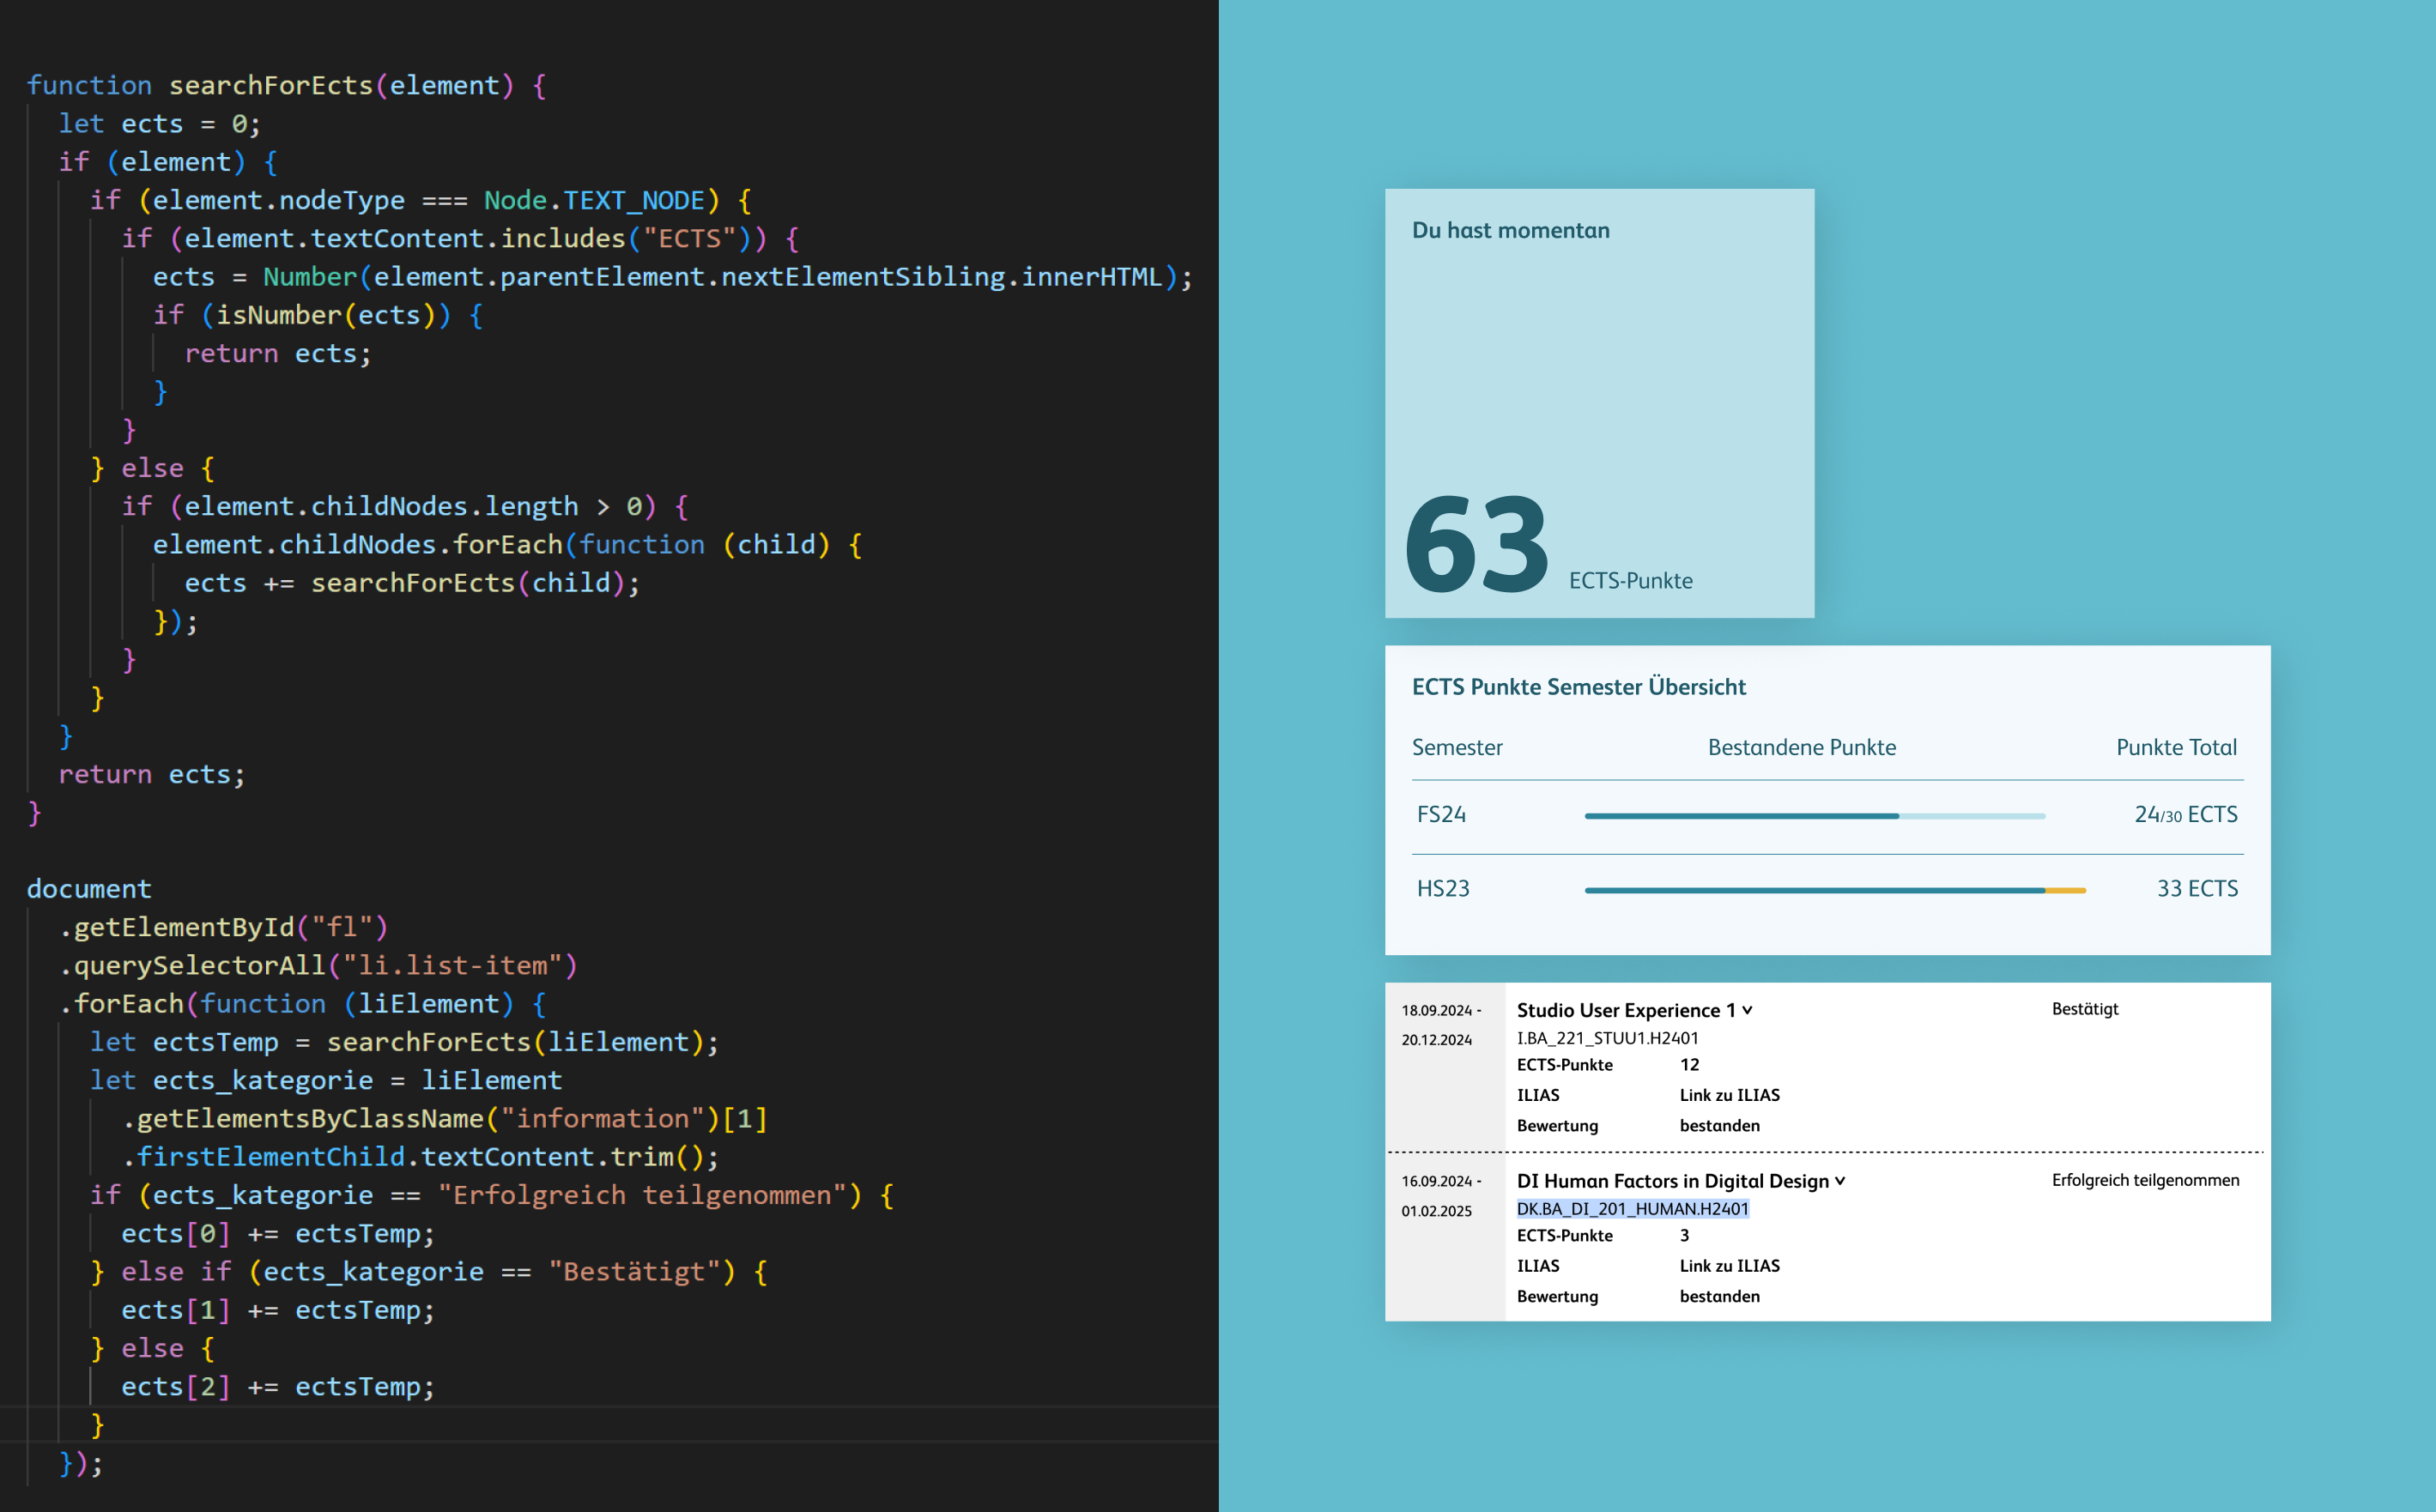
1. DOM parsing from “My Registrations”
The ECTS totals and semester breakdown are derived directly from the “My Registrations” page by parsing the DOM structure and extracting credit values from each module entry. To ensure the dashboard reflects realistic progress, the extension also interprets module status labels and applies clear counting rules, instead of simply summing every listed credit value. This combination of data extraction and status logic was essential to keep the overview accurate and trustworthy.
2. Cross page limitation and explicit refresh actions
A browser extension can only access data from the currently open page, which meant we could not automatically combine information from different myCampus areas in the background. To handle this constraint transparently, we introduced explicit refresh actions, so users can update the dashboard based on the page they are currently viewing. This kept the interaction predictable and avoided the impression that the extension is silently pulling data from elsewhere.
Final Outcome
A fully functional Chrome extension ready for manual installation and use.
A fully functional Chrome extension was built to run directly in myCampus and turn registered module information into a clear ECTS planning dashboard. It highlights the total ECTS count and provides a detailed semester-by-semester breakdown, making credit progress instantly readable. A side panel complements the dashboard with quick links to key myCampus areas for faster navigation.
To make the Extension easy to use, we also delivered a short installation guide for manual ZIP setup in Chrome.
We did not implement the planned “Upcoming module registrations” view due to limited time. In practice, students are typically reminded about these registration windows through email and calendar notifications, so we prioritised shipping the core ECTS dashboard and included a Personal Details panel instead.
Reflecion & Learnings
Practical learnings from designing and building my first browser extension.
Working with Yannick was highly efficient and collaborative. We shared responsibilities across problem framing, interface design, and implementation, which kept decisions fast and reduced handover friction. Despite the short timeframe, we shipped a working extension and gained hands-on insight into what browser extensions can and cannot do.
The most effective part of our approach was choosing a solution that could live directly inside the existing myCampus flow. Instead of outlining how the platform should change, we delivered a usable tool that integrates into the real planning moment and removes the manual ECTS counting work.
Learnings
Constraints shape interaction design
Browser extension limits directly shaped the UX. Since the extension only works on the currently open myCampus page, we relied on explicit refresh actions and clear states to keep the dashboard predictable and reliable.
Scope discipline beats feature ambition
With limited time, we prioritised what removes the core friction: total ECTS, semester breakdown, and fast navigation. Nice-to-have features were simplified or replaced to ensure we could ship a functional Chrome extension.
Shared ownership accelerates execution
A shared understanding of goals and responsibilities enabled fast decisions across design and development. This made it possible to deliver a functional prototype within a very short timeframe.
Workflow Atlas of this Project
A focused snapshot of the methods behind this project. This condensed Workflow Atlas highlights only the phases and techniques applied here, showing the key artifacts and decisions that shaped the outcome.


